Best Tesla Model 3 and Model Y compatible tires
compared using TireRack, BlackCircles and TyreReviews
Last updated 2025-07-25

Well, it's been just over five years since I posted Version 2 of the tire comparison, and by popular request (and since my own Model 3 tires were getting a bit stale), I now present at last, an update - Version 3.
Compared to last time, I've included tires for the Model Y (yay!) and around 50% more tires overall. In fact, most of the tires in the list are new or upgraded versions from previous tires. It just goes to show, a lot can happen in 5 years. The yellow (new), orange (existing from Version 2), and maroon boxes near the far left of the table indicate if the tire is new, existing or potentially discontinued from last time.
Apologies to S/X/Cybertruck owners, but adding those would have been a royal pain, at least going by the multiple tire sizes I saw as options for the S. However, such owners can still look at the top picks and check if a tire is available in their chosen size. There's also a heavily improved ranking system which weights each score according to the number of ratings it has (more details on that later). TireRack average ratings are also more accurate (even more so than what they portray on their own site (!) - see later).
As before, take all ratings with a grain of the finest Himalayan salt. Stats
Now the notes!
Initial procedure to pick tires for the shortlist:
There was a much longer list of tires of around 340-350 tires before I fired around 80% (afuera!) to create the final shortlist of 72. I exhaustively searched on Tirerack and TyreReviews for the common sizes found on the Model 3 (235/45-18", 235/40-19", 235/35-20" (and the new 275/30-20"!)), and Model Y (255/45-19", 255/40-20", 255/35-21", & 275/35-21"). Criteria for chopping tires out included factors such as a low average user rating, low number of ratings, inappropriate load index or speed rating figures, or to push it over the edge, an uncommon tire (e.g: fitting just one of the rarer sizes above). Default Tesla-approved tires were included regardless of other factors.Compatible with your car?
In theory, as long as you pick the right column for your car (3 / Y) and tire size (18", 19", 20", 21"), these tires should all be compatible. However, you may want to keep an eye on the Extra Load mark (reinforced internal structures, often with stronger sidewalls to reduce chances of a blowout from side impacts), Load Index (how much weight each tire can withstand) and Speed Rating (kind of how fast you can go before the tire's limit, but it's a bit more involved than that and can affect safety even if you drive under the limit). The latter two are shown as a number + letter next to the green ticks in the table (e.g: "98Y"). If in any doubt, go for a similar spec OR BETTER (higher) than your existing tires as some places won't even sell or fit tires on your Model 3 unless they match or exceed the specification for these attributes. Additionally, there's obvious safety concerns and even legality issues in some countries when undersizing. I also highly recommend you get a tire which has the "XL" label, as the vast majority of Tesla fitted tires have this attribute as standard.Having said that, curiously, the Hankook Kinergy PT, despite lacking an XL mark, and only being a 94V tire, was a standard Tesla 18" tire for the Model 3 at one point, so technically such tires can be used (source). Weirdly enough, you get low Load index ratings but with an "Extra Load" rating, and higher Load indexes without an "Extra Load" rating.
Also watch for subtle variants of a tire. For example, the Michelin Pilot Sport 4S has three variants for the 20" version of its tire for the Model 3, all of which are labelled 235/35-20". One of them has the style as "Blackwall", one as "N0(Porsche)", and the third as "T0 Tesla, Acoustic Tech". I think you can guess which is the correct one to go for. If with other tires, there are similar variants but no mention of "Tesla" in the style, again look for the XL mark, Load Index and Speed Rating, and pick the one which is similar (or better) to your existing tires. For example, the Pirelli P Zero (PZ4) has two tires labelled "235/45ZR18". However, one has a "(98Y)" mark and the other is "94Y". Most Model 3 tires use something on (or close) to the former, so you'd go for that.
And a small note: Unless you're looking to really maximize range, you don't really need an "EV tire" for an EV car. Some of the strongest tires on a Tesla in terms of traction/safety are non-EV specific (see 22:50 in the video from this site).
Global versus US tire availability
The green tick boxes under the Model 3 and Model Y tire size columns indicate if that tire is available for your car. However these are generally only taken from the US TireRack site. Tyrereviews.com (expanded from the UK) and BlackCircles' tire availability was much more patchy and inconsistent as tire sizes were in one minute and gone the next. During the creation of this project, I found this unreliable availability of sizes was also present a bit on Tirerack so don't be surprised if your chosen size isn't available anymore. Equally though, even if a size isn't listed (green ticked) in the table, it may worth checking in case it becomes available again. Finally, tires available abroad may not be available in the US and vice versa, or they may even come under different names.Miscellaneous stuff
UTQG traction: I wouldn't trust the UTQG traction rating since that test looks for the braking capability for stopping of a locked tire rather than one which turns at or near its limit due to modern ABS, and it turns out there isn't a simple correlation between these two.EU tyre label: Due to reservations from last time, and patchy existence of data, I have omitted the EU tyre label stats from the table this time round. I may put it back later.
Tire efficiency, fuel-efficiency / rolling resistance: Like last time, I had trouble looking for consistent data, but I may add this stat to the table if something is found. Most sources for this sort of thing only compare a limited number of tires at any one time (e.g: 1, 2 ). Consumer Reports offers something, but even there, most of the tires in this list aren't featured at CR, and I would be reluctant to list them due to copyright reasons. The EU tyre label has the stat, but that has its own problems as already mentioned.
Rim protection: Some people may want rim protection so that they're less likely to damage their wheels. Look for tire labels such as RFP or FP. In addition, many tires may skip the label yet still have decent protection. For example, my CrossClimate 2's have about an extra millimetre of rubber (3.5 -> 4.5mm) sticking out from the tire sidewall compared to my old Michelin PS4's, despite no mention of any FP label or similar.
The Bridgestone Turanza EL400-02 (and to a lesser extent the Bridgestone Blizzak LM001) was one of the worst tires I found but was added to contrast with the rest to get an of how ratings compare if you go for the bottom of the bucket. Bridgestone make some decent tires, just not these two.
Rating system
This is one of the biggest improvements with the table from 5 years ago. Instead of naively going off a rating, there's a technique inspired by Bayesian probability that penalizes a score when there's only a few reviews for it. In the old comparison, the Bridgestone Turanza QuietTrack tire only had 18 ratings, but it shot to the top of the All-Seasons category with a score of 96.7%, almost certainly by luck alone. That same tire now only scores the equivalent of 86.6% on Tirerack (4.33*20 = 86.6%).TireRack provides ratings for almost every tire they list. However I was shocked to see how flawed their method was to calculate the final average. Instead of going by the whole AND half stars available from their user reviews, they round each user rating down to the nearest whole number and instead use THAT to calculate the average (for example, a rating of 4.5/5 would be rounded to 4 for the final average). Luckily, I created a Regex to sift through the reviews and tally the user ratings (including half scores) DIRECTLY. I was careful not to count any unrated reviews in the tally of the final division number. Thus the ratings in my table are *more* reliable than the ratings TireRack give on their own site!
As a small note, Tesla owner specific ratings from the Tirerack site are a column in their own right. These weren't given any weight to the final rating, so that can be a judgement call for you to decide.
Final ratings
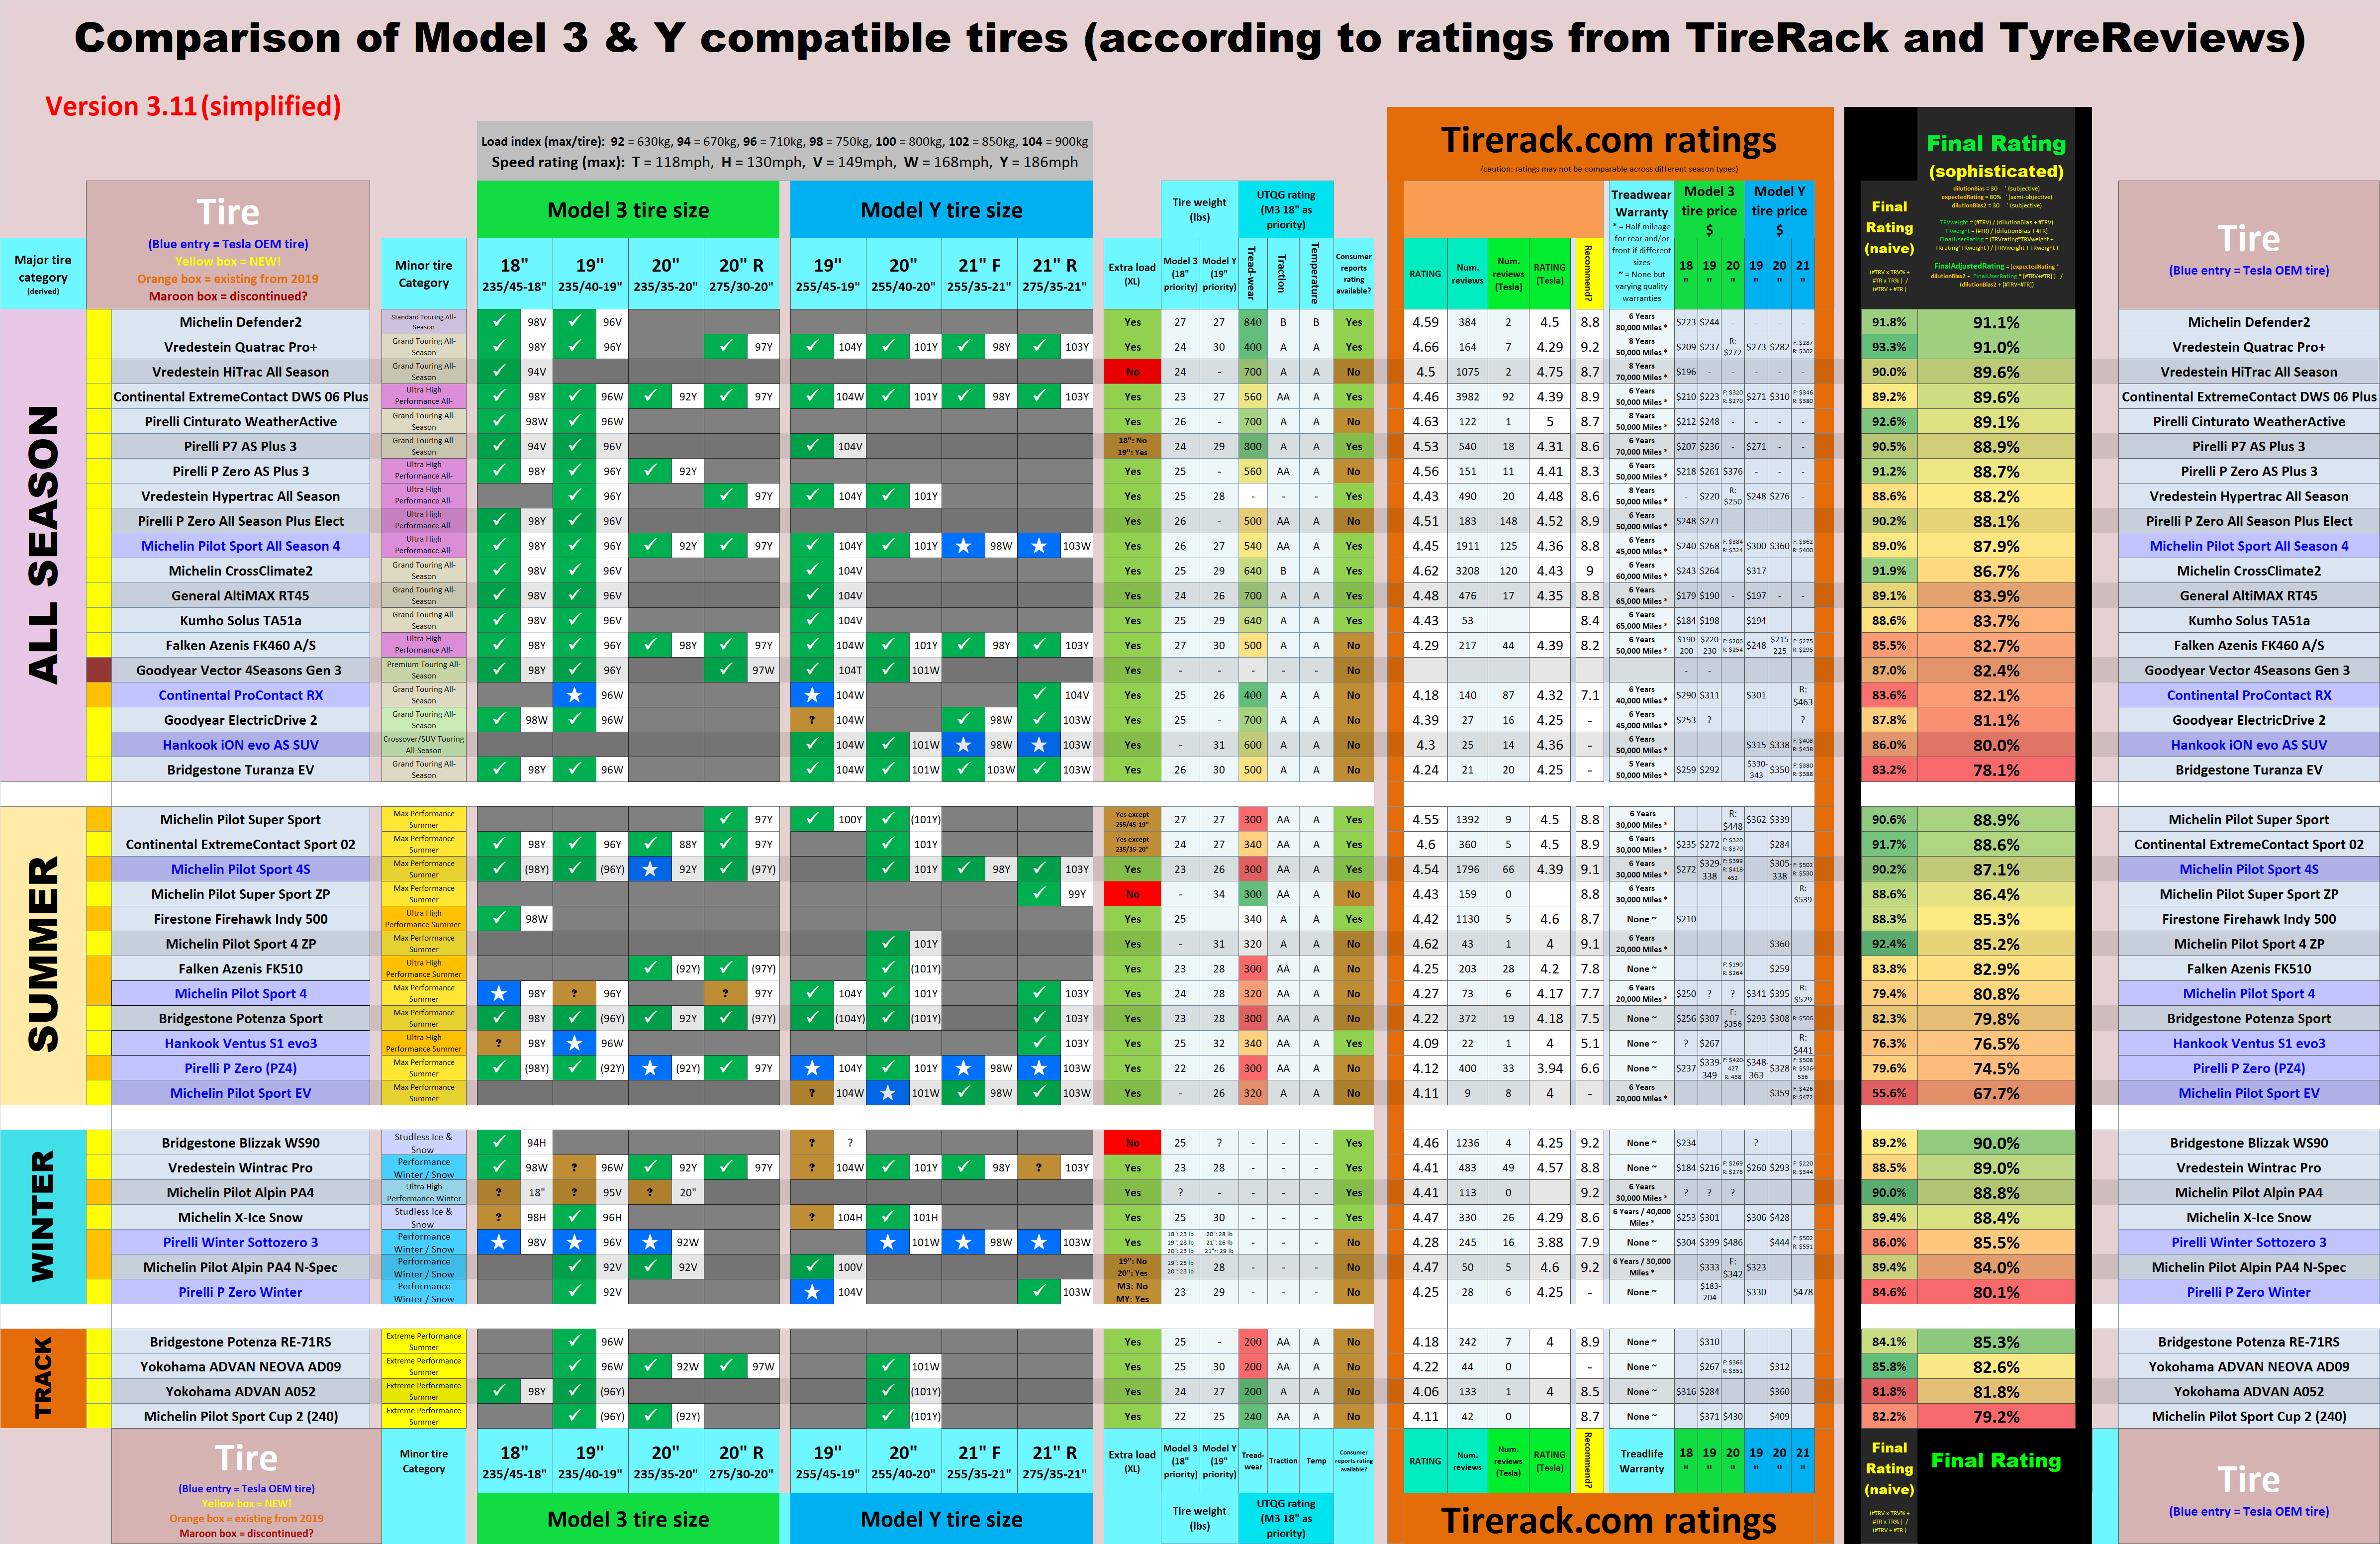
For those who think that's information overload, here's a simplified version of the table with less tires and columns:
More details on the Rating system
Recall we were talking about how TireRack miscalculate the average. For example, their Hankook Ventus S1 evo2 SUV has three 2.5 star reviews, four 3 star, seven 3.5 star reviews, three 4 star reviews, two 4.5 star reviews, and one 5 star review. The maths should be easy to find the average: `(2.5*3 + 3*4 + 3.5*7 + 4*3 + 4.5*2 + 5*1)` / `(3 + 4 + 7 + 3 + 2 + 1) = 3.5`, but unbelievably they round down the half numbers to make it: `(2*3 + 3*4 + 3*7 + 4*3 + 4*2 + 5*1)` / `(1 + 2 + 3 + 7 + 4 + 3) = 3.2`. Massive difference. The problem doesn't go away with massive numbers of reviews either.
I almost incorporated the ratings from BlackCircles this time, but I found the ratings were unusually high and low contrast. This may be due to a number of reasons. BlackCircles doesn't just sell tires, but fits the tires too. As a result, one might speculate people are partially rating the service too in addition to the tire. Or maybe their userbase is less discerning and almost every tire is like a 5 star to them. I did check, but I couldn't find any signs of dubious activity to explain why the ratings were high for all the tires there. Anyway, I've included the ratings in the table, but they don't form part of the overall score.
Formula explanation (for us geeks)
For what it's worth, I included the naive way of calculating the Final Rating. In the table, the sub-heading is labelled "naive", so you should probably ignore it. In any case, the formula for that is: `(#TRV x TRV% + #TR x TR%) / (#TRV + #TR )`, where '#' means number of reviews, 'TRV' means TyreReviews, and 'TR' means TireRack. Simple stuff to calculate the average of many rated reviews.
Now the "sophisticated" formula which uses the score penalization method described above when there's less reviews:
- dilutionBias = 30 ' (subjective)
- expectedRating = 80% ' (semi-objective)
- dilutionBias2 = 30 ' (subjective)
- TRVweight = (#TRV) / (dilutionBias + #TRV)
- TRweight = (#TR) / (dilutionBias + #TR)
- FinalUserRating = (TRVrating*TRVweight + TRrating*TRweight ) / (TRVweight + TRweight)
- FinalAdjustedRating = (expectedRating * dilutionBias2 + FinalUserRating * [#TRV+#TR] ) / (dilutionBias2 + [#TRV+#TR])
I'm not going to thoroughly explain the formula (if you want to learn about that, visit that link from earlier and the next bit is a variation derived from that), but suffice to say what's happening is that the average rankings for each review site (TyreReviews and TireRack) are calculated, and each rank is given a weight, based on the `dilutionBias` variable, so that lower numbers of reviews for a tire will influence the overall amalgamation average (`FinalUserRating`) to a lesser degree. This number is then fed into a final adjustment formula (`FinalAdjustedRating`) to 'magnetize' the figure towards the `expectedRating` variable, again based on the number of total reviews for ALL of the review sites. This final bit uses the method explained in the answer at StackOverflow directly. The dilutionBias and expectedRating variable values are somewhat subjective and arbitrary, but I experimented and found what I thought were the most reasonable figures to use. Changing the dilutionBias values to even double or half had little effect on the placements of each tire in the final list, though the expectedRating (a number which is roughly the median rating of all the tires) had a fair amount of influence.

All text on this page is copyright D. White 2019 onwards.
Please ask for permission should you wish to use the text material on these pages.